The read
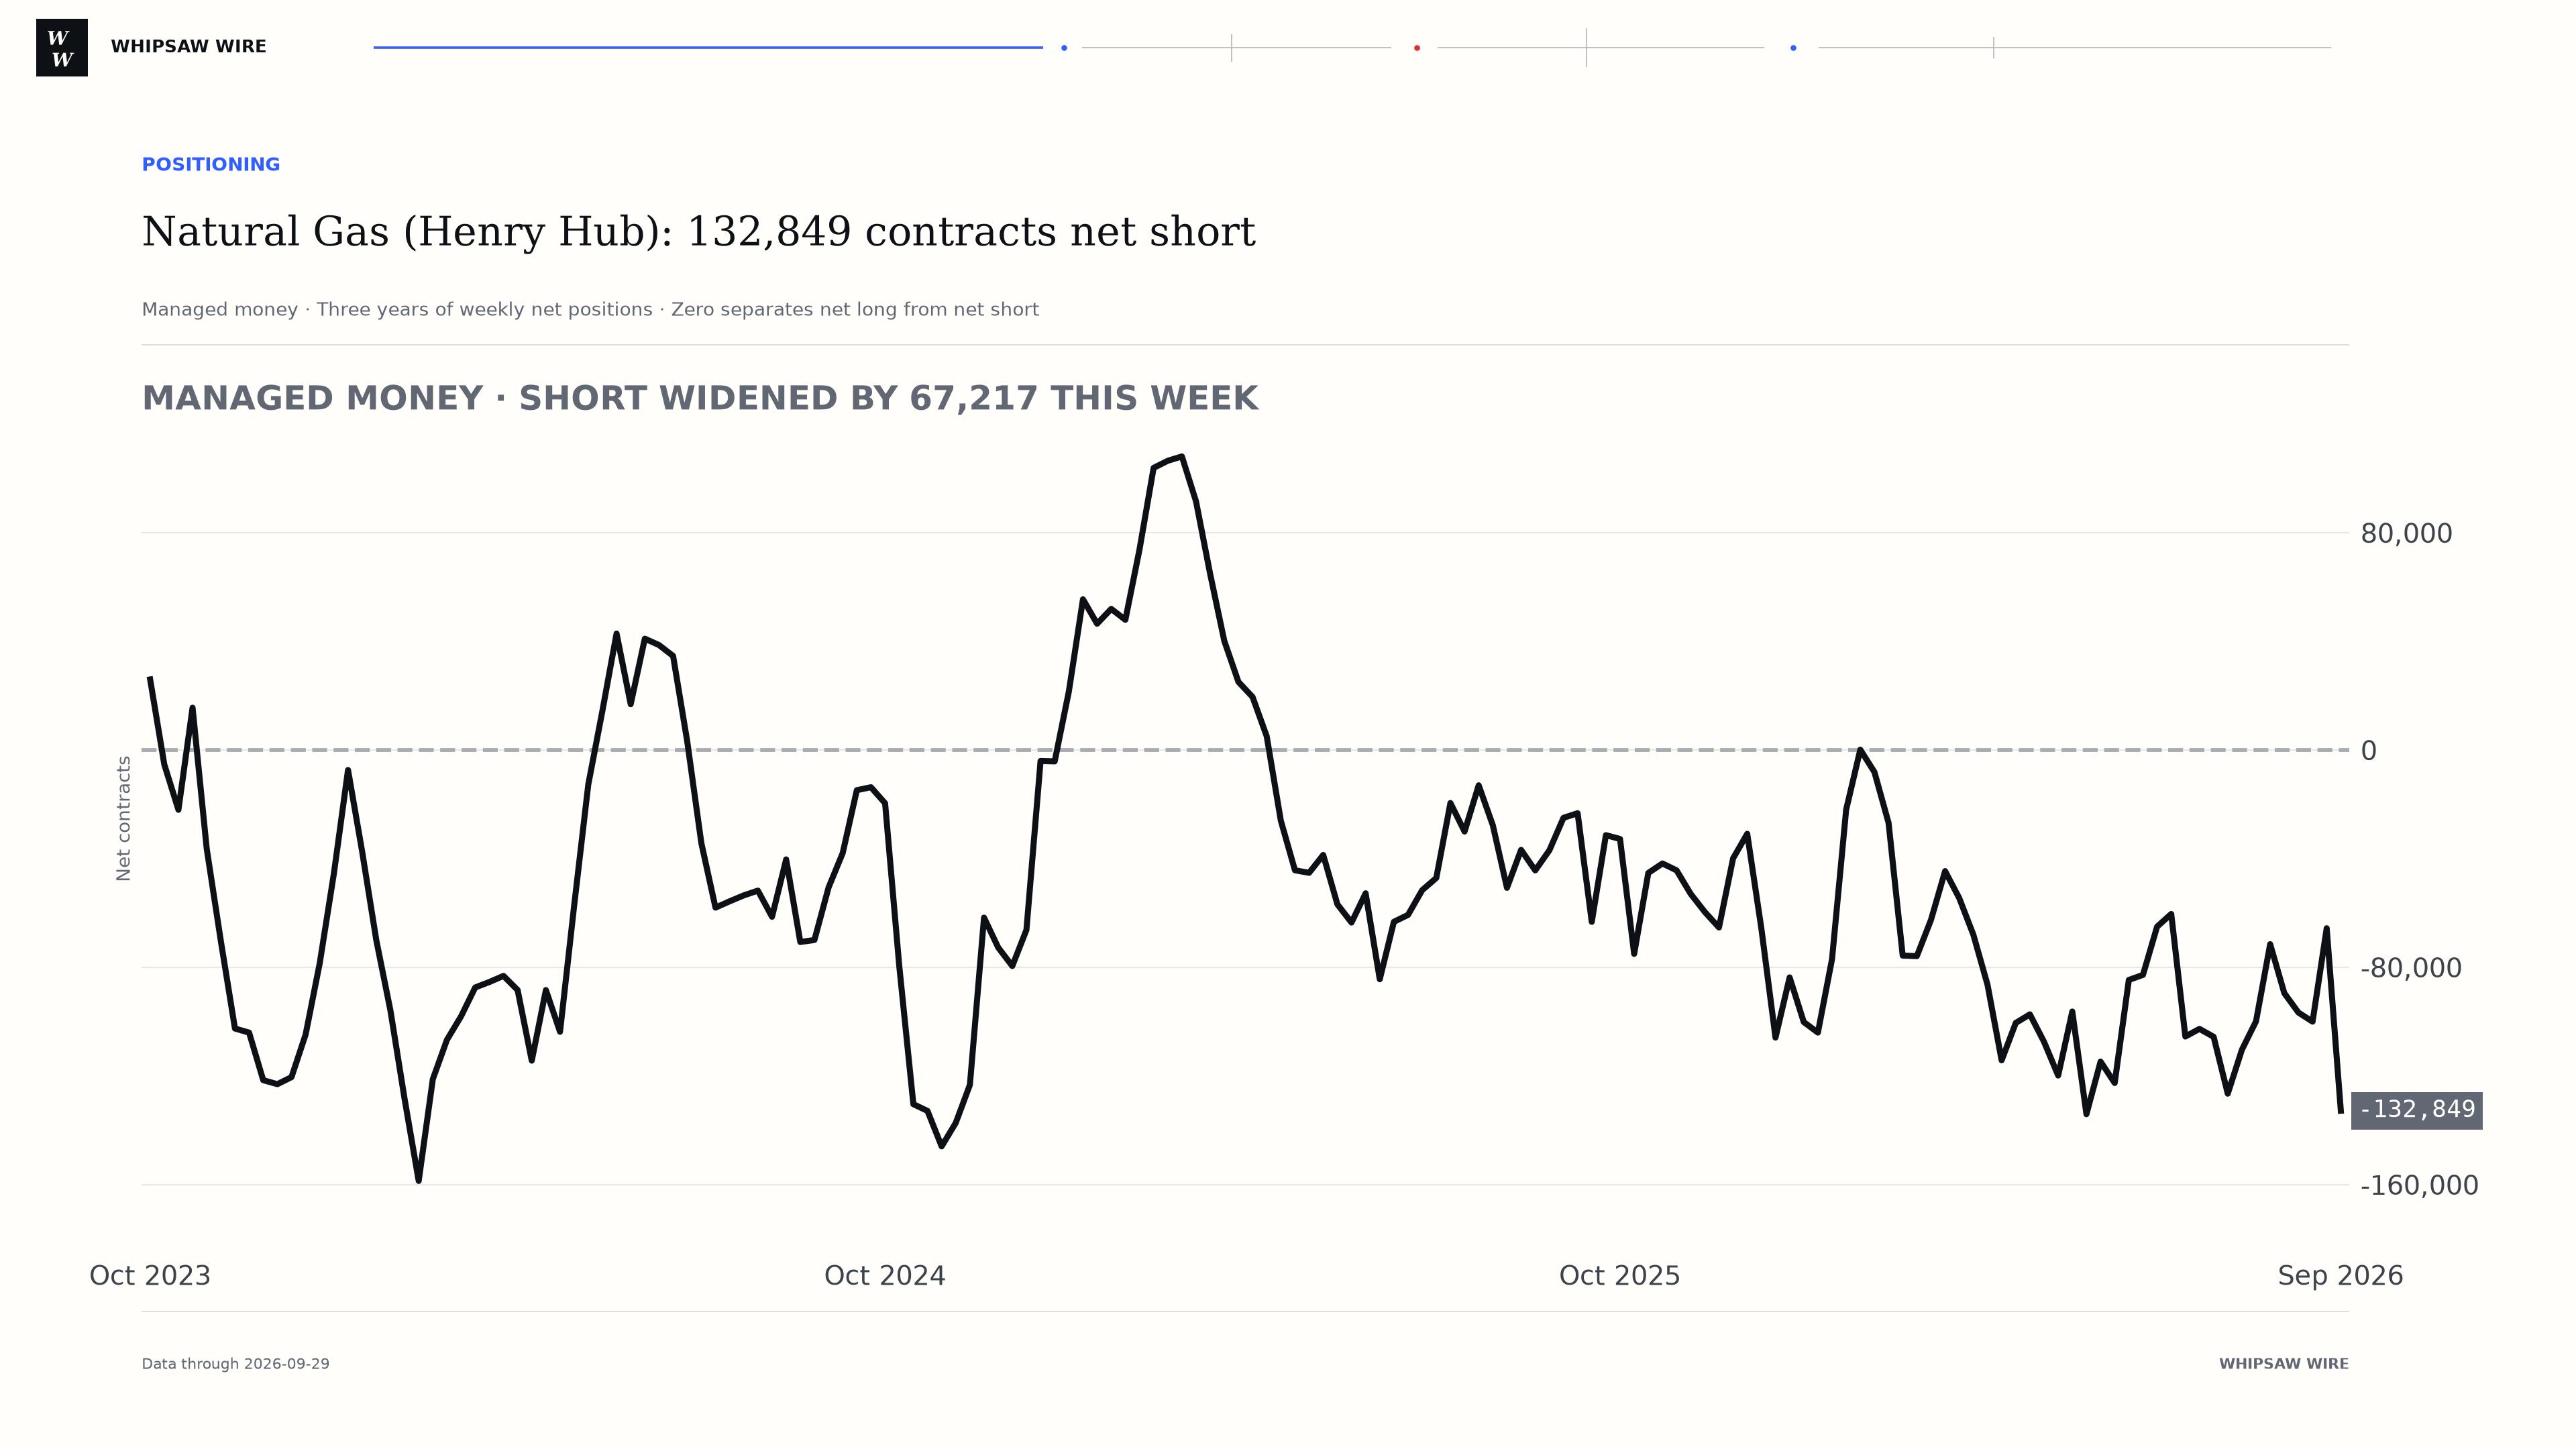
In the September 29 report, managed money's net short in natural gas grew by 67,217 contracts to 132,849, roughly double the week before. It now equals 7.4% of open interest and sits at the 4th percentile of its three-year range, the short end.
Most of the move was longs leaving. Managed money held 46,038 fewer long contracts and added 21,179 shorts. That reverses the previous week, when the net short narrowed by 34,392, and leaves it 43,326 larger than four weeks ago.
Price and positioning are pointing different ways. Natural gas was at a 12-week high on Tuesday, while managed money's positioning moved the other way over those 12 weeks. The report shows that disagreement; it does not say how it resolves.
The week also spans the October contract's last trading day, September 28, so some longs may have closed rather than rolled into November. The 21,179 new shorts are not explained that way.
Natural gas positioning
Natural Gas (Henry Hub): 132,849 contracts net short
Who moved
Other reportables bought back shorts.
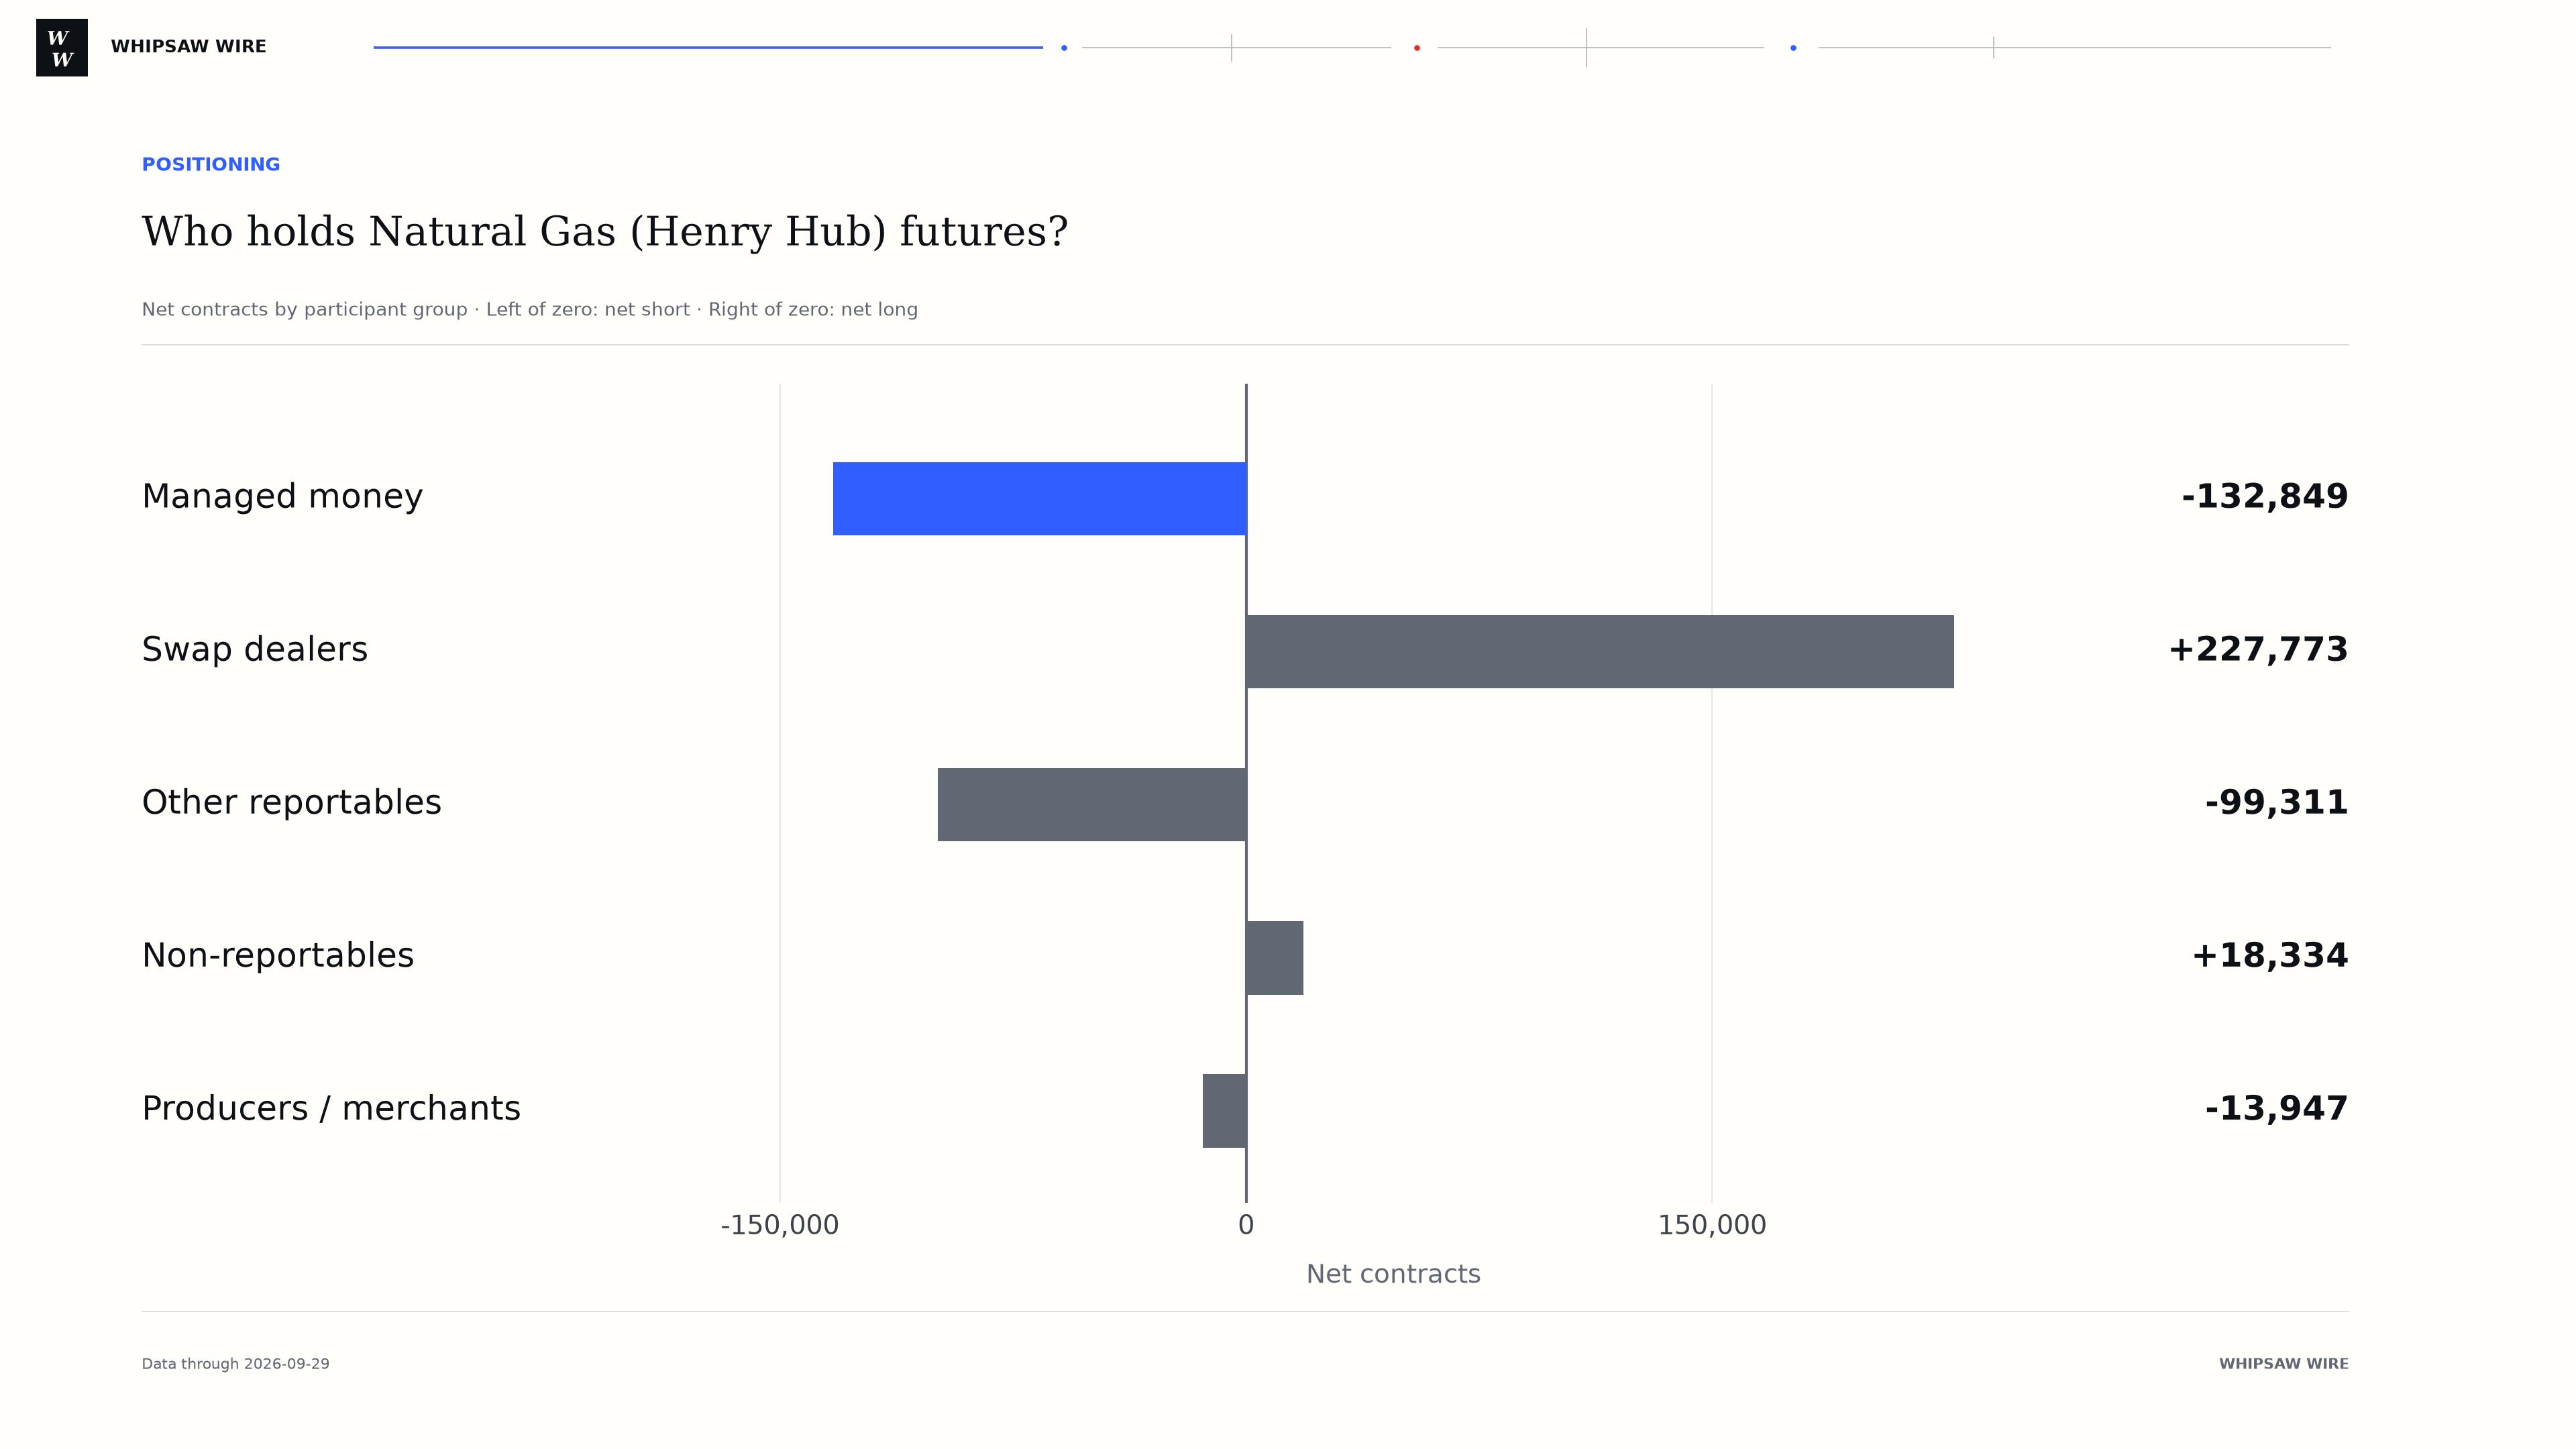
Other reportables cut their net short by 50,659 to 99,311, holding 35,214 fewer shorts and 15,445 more longs. Producers and merchants narrowed their net short by 9,680. Swap dealers stayed net long 227,773, little changed.
These are balances within this futures market, not whole portfolios.
Who holds natural gas futures
Who holds Natural Gas (Henry Hub) futures?
What would change the read
Does the short keep growing?
A second week of new shorts would extend the build. If longs return as November positions, part of this week's drop was the October expiry. A narrowing like the previous week's 34,392 would make this look like a swing rather than a trend.
The anchors
ES · CL · GC
S&P 500
Net short 374,007 contractsLeveraged funds added 5,391 shorts and 7,000 longs, so the net short narrowed by 1,609. It equals 19.6% of open interest.
WTI crude
Net long 122,916 contractsManaged money's net long shrank by 19,672 contracts: 12,530 fewer longs and 7,142 more shorts. It is still 3,297 larger than four weeks ago.
Gold
Net long 124,418 contractsManaged money's net long shrank by 6,916 contracts this week and 16,393 over four weeks. It sits at the 37th percentile of its three-year range.
Elsewhere
Four other positions worth a look.
Canadian dollar shorts grew
Leveraged funds added 24,949 short contracts, widening the net short by 22,783 to 69,644, 20.1% of open interest. Dealers took the other side, adding 35,635 longs.
Treasury note shorts grew too
In 10-year T-note futures, leveraged funds added 151,495 shorts and 42,010 longs. The net short widened by 109,485 to 2,036,432 as open interest rose 5.0%.
Corn and soybean longs shrank
Managed money's corn net long fell by 36,587 to 377,850, and its soybean net long by 23,877 to 241,164. Both remain at the long end of their three-year ranges, at the 97th percentile.
Sterling reached the short end
Leveraged funds' sterling net long fell by 8,633 to 4,606, and by 38,561 over four weeks. Still net long, it now sits at the 5th percentile of its three-year range.
One week later
The S&P shorts held, and the yen crossed back.
- Last week: would the new S&P shorts outlast the roll? The test was whether leveraged funds' gross shorts would hold near the 495,082 reached after the September expiry.
- This week: they held. Gross shorts rose by 5,391 to 500,473. Open interest barely rebuilt, up 0.3%, so the test continues.
- The yen crossed back to net short. Leveraged funds' yen position moved from net long 7,423 to net short 14,161, undoing the crossing first reported on September 15. Longs fell by 15,494 and shorts rose by 6,090.
- Copper's rebuild paused. Managed money's net long fell by 3,940 to 78,709, still at the 97th percentile, the long end of its range.
- Next report: Whether natural gas shorts keep growing, and whether S&P gross shorts stay above 495,082 as December open interest builds.
Positioning reference
Where positioning sits in its 3-year range.
| Market | Net position | 3-year percentile | At this end |
|---|---|---|---|
| Lean Hogs | Net short 44,186 (10.3% of open interest) | 1st | 18 reports |
| Russell 2000 | Net short 114,554 (26.8% of open interest) | 1st | 8 reports |
| Sugar No. 11 | Net long 227,821 (16.8% of open interest) | 98th | 7 reports |
| Mexican Peso | Net long 80,587 (29.3% of open interest) | 98th | 10 reports |
| Gasoline (RBOB) | Net long 94,018 (27.3% of open interest) | 98th | 7 reports |
| Corn | Net long 377,850 (14.7% of open interest) | 97th | 7 reports |
| Copper | Net long 78,709 (24.7% of open interest) | 97th | 2 reports |
| Soybeans | Net long 241,164 (17.9% of open interest) | 97th | 6 reports |
How to read the table
Side and unusualness are different questions.
The percentile places each net position among its last 156 weekly readings. It says how unusual a position is, not which side it is on: a net long can sit at the short end of its range.