The read
The September 22 report is the first since S&P 500 futures expired on September 18, and it shows. Open interest fell 23%, from 2.48 million contracts to 1.90 million, as the September contract rolled off. In the last 11 reports like this one, the leveraged-fund net position moved by a median 51,559 contracts, against 28,101 in weeks away from any expiry. In 9 of those 11 the net short narrowed. This week it widened, and the change was the 4th largest of the 12.
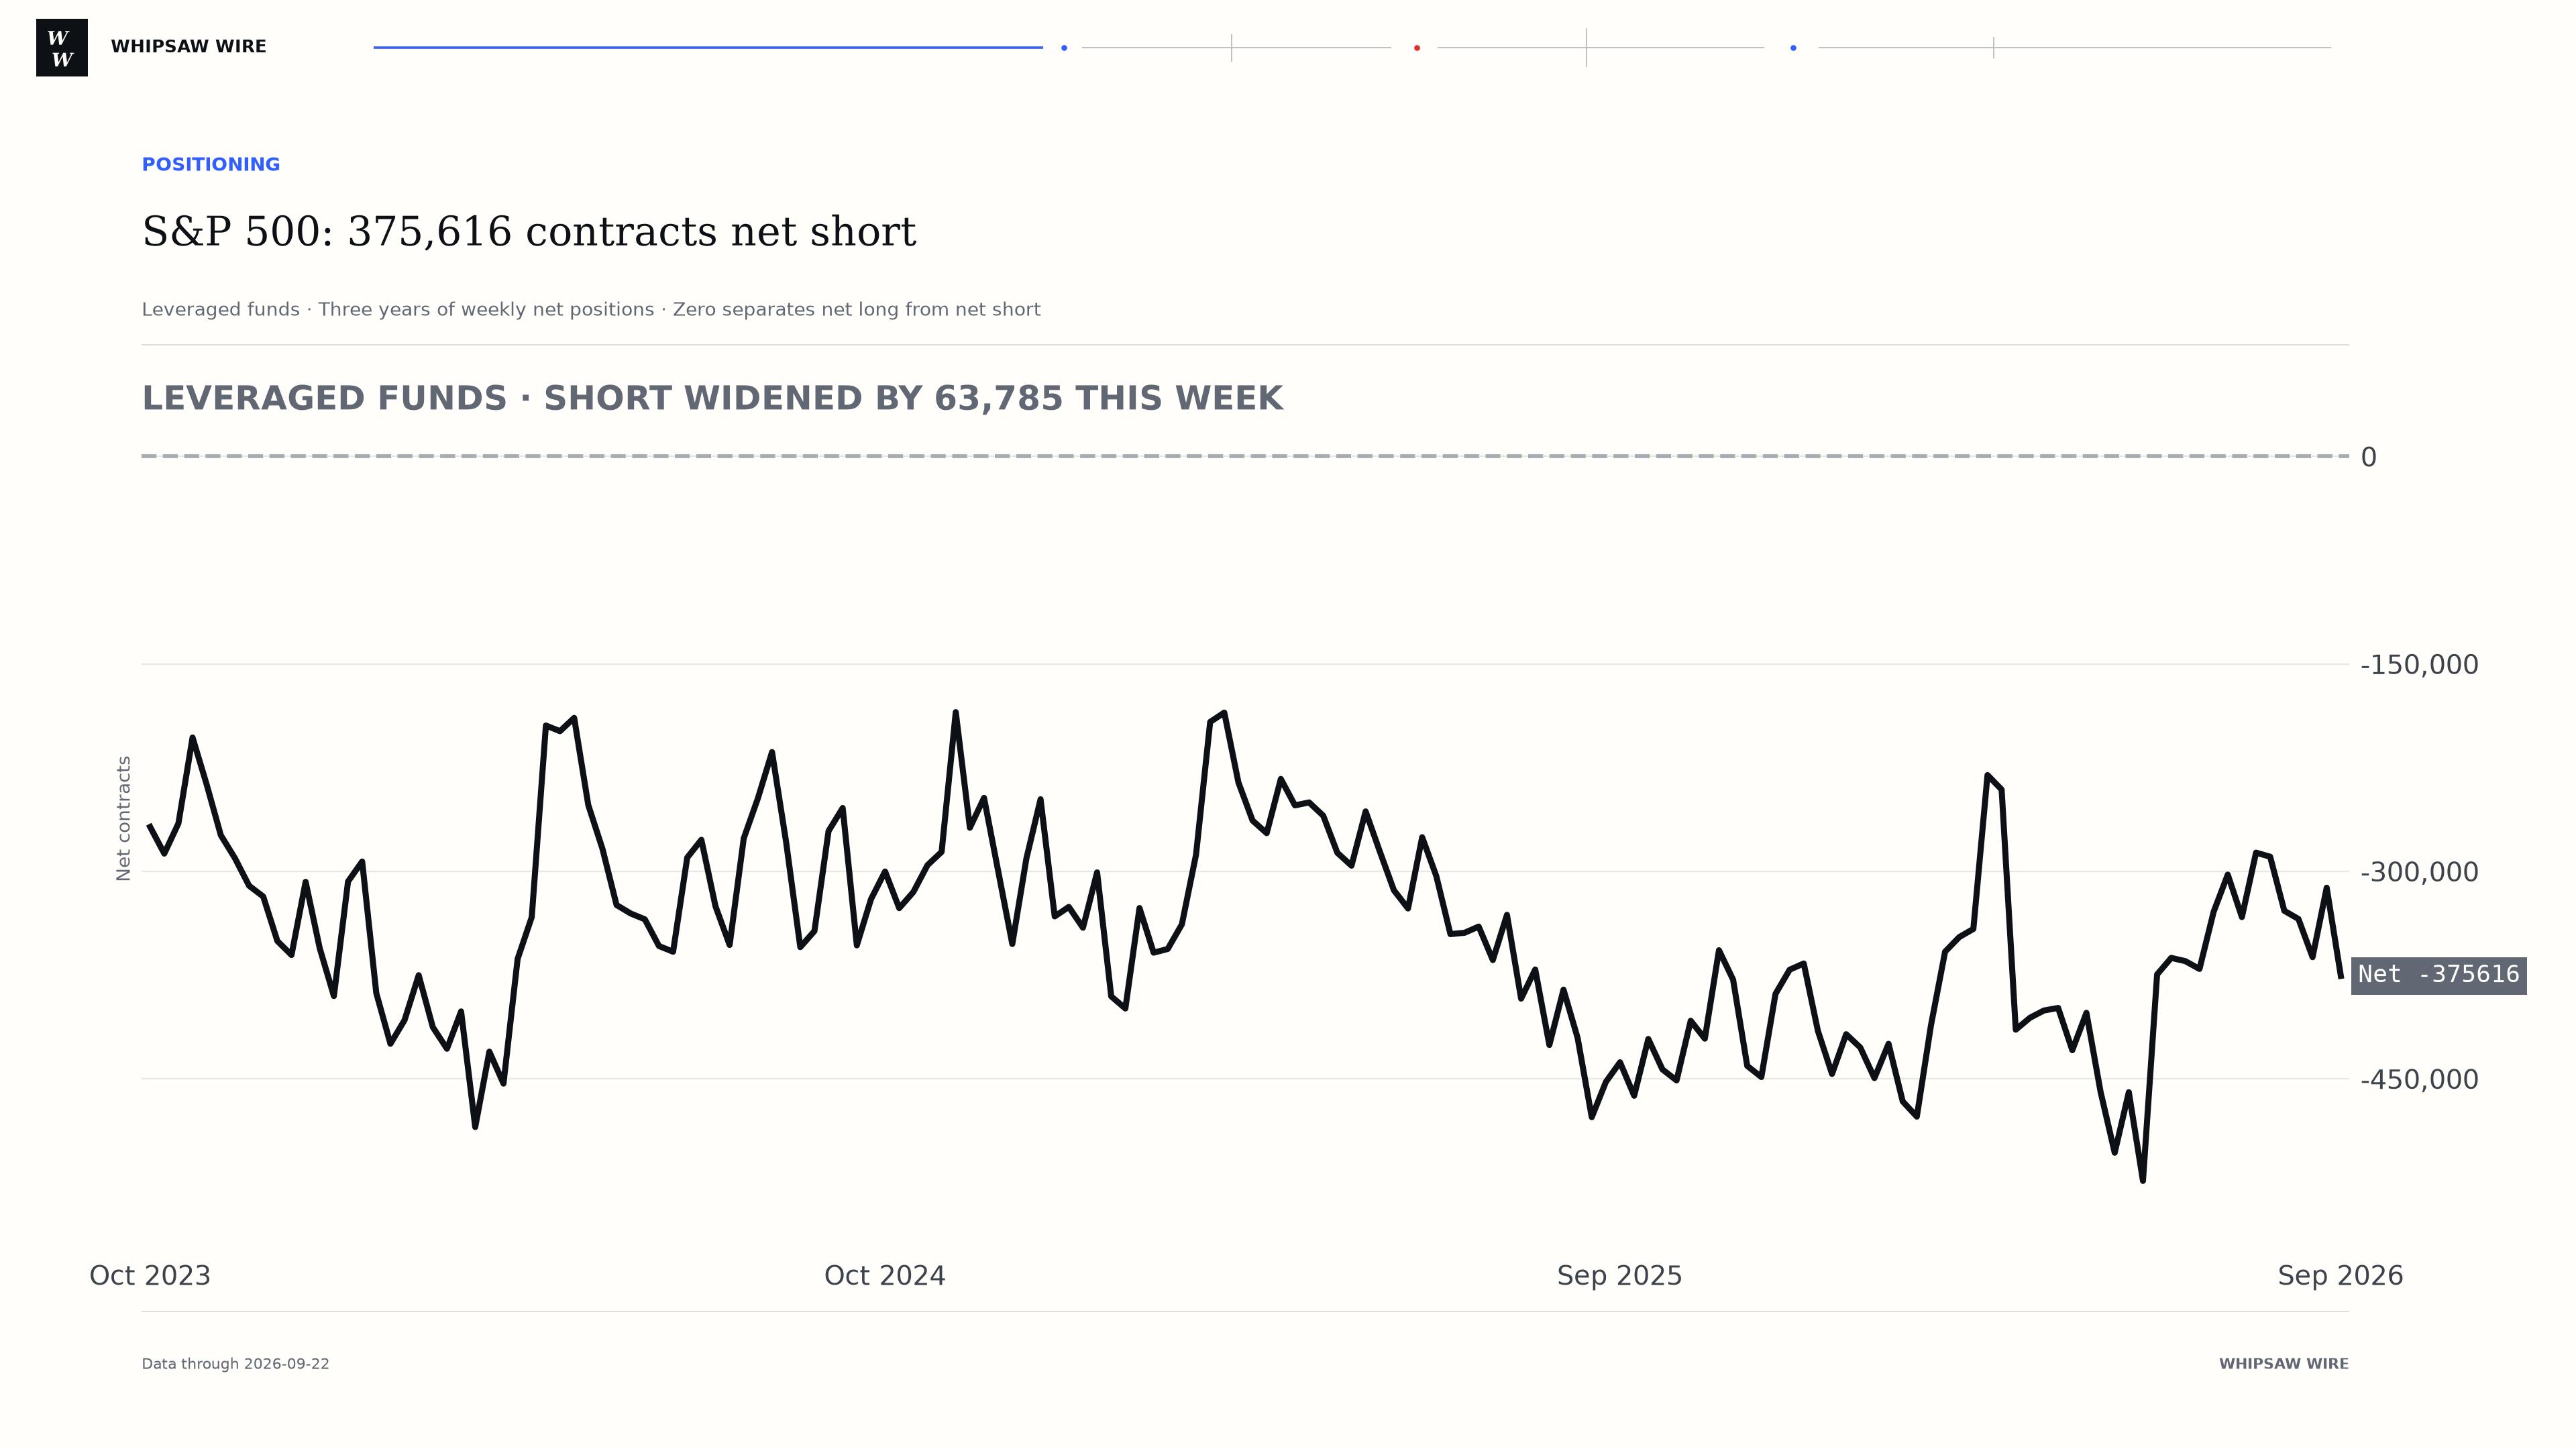
Against that backdrop, leveraged funds widened their net short by 63,785 contracts to 375,616. What stands out is how. Their gross shorts rose by about 37,000 even as open interest shrank by almost a quarter, while their longs fell by about 27,000. New shorts did more of the work than departing longs.
Part of the jump in the short's share of open interest, from 12.6% to 19.7%, is the smaller denominator after expiry. At the 31st percentile of its three-year range, the net short is deeper than most weeks but far from an extreme.
S&P 500 positioning
S&P 500: 375,616 contracts net short
Who moved
Asset managers covered shorts. Dealers cut both sides.
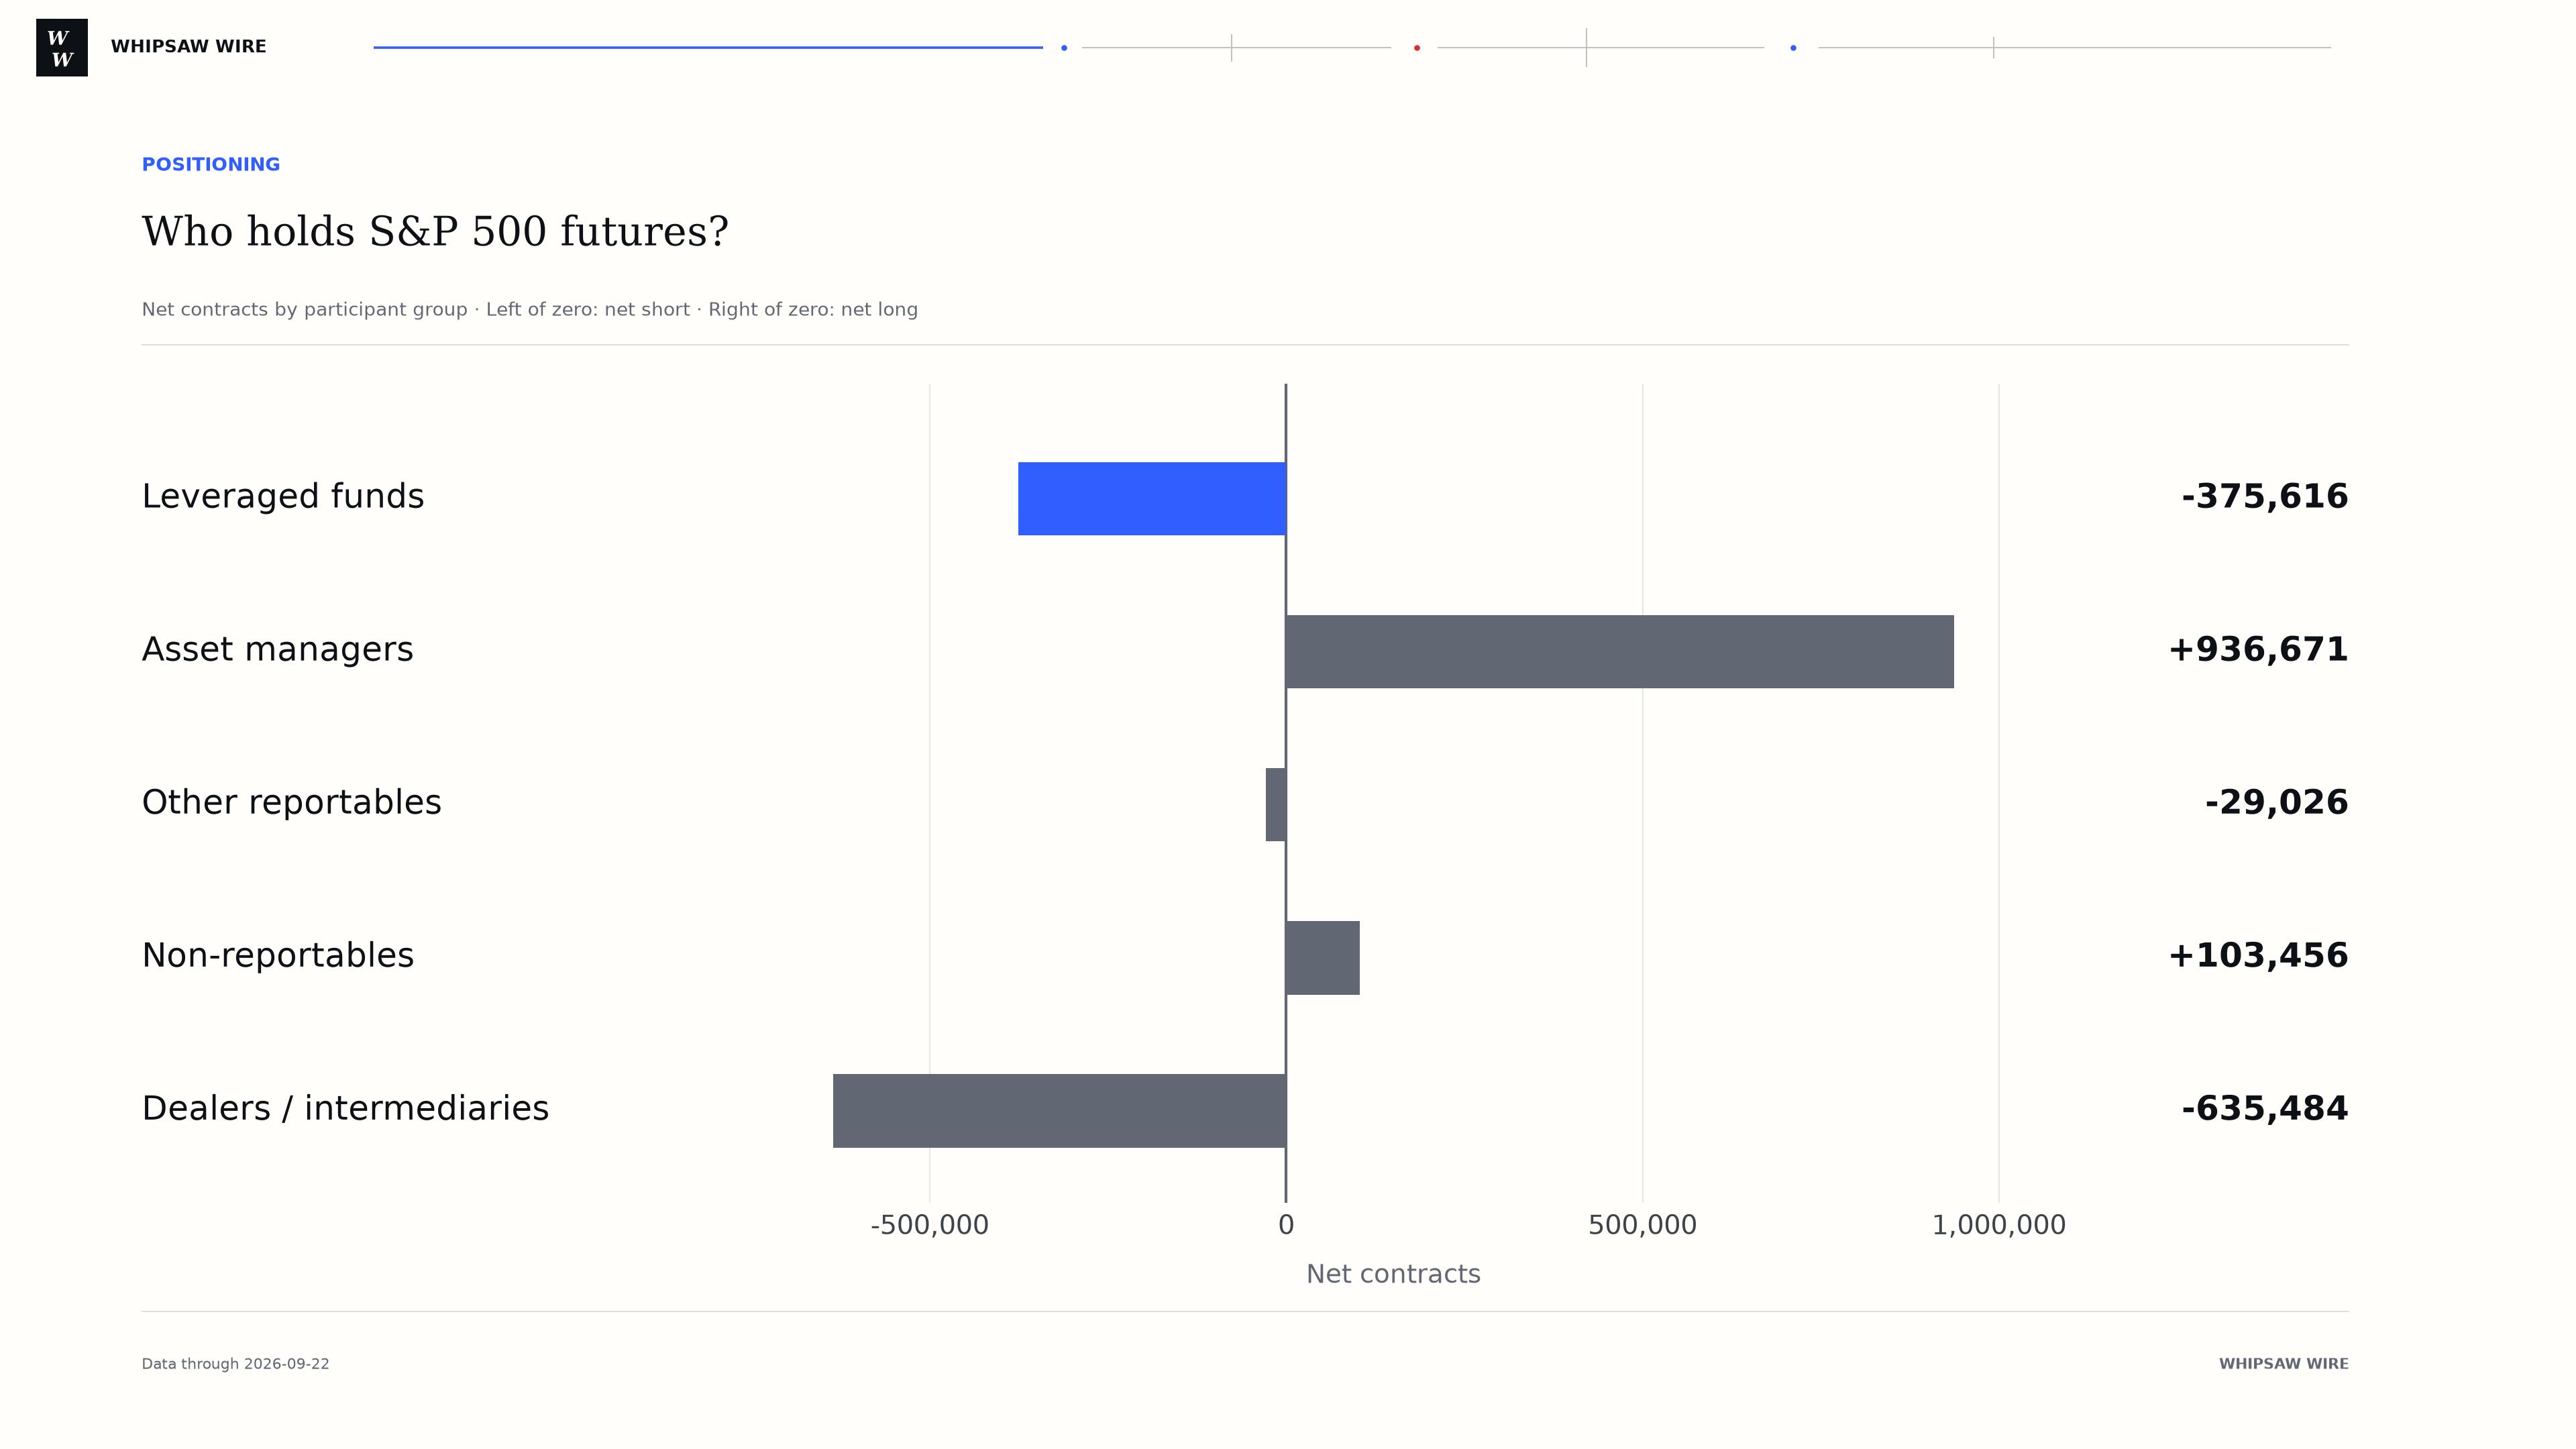
Asset managers' net long rose by 30,017 to 936,671: they held 53,444 fewer short contracts and 23,427 fewer longs. Dealers cut shorts by 99,240 and longs by 52,929, leaving their net short 46,311 smaller at 635,484.
The report shows positions, not motives. A leveraged-fund short in index futures can be one side of a trade against the stocks themselves, so a larger short is not necessarily a bet on lower prices.
Who holds S&P 500 futures
Who holds S&P 500 futures?
What would change the read
Does the short outlast the roll?
The next two reports should show whether the added shorts last beyond the roll. If gross leveraged-fund shorts hold near 495,082 as open interest rebuilds in December contracts, they outlasted it. A fall back toward the 458,094 held before expiry would mean they did not.
The anchors
ES · CL · GC
S&P 500
Net short 375,616 contractsLeveraged funds' net short equals 19.7% of open interest, up from 12.6% before expiry, partly because open interest fell 23%.
WTI crude
Net long 142,588 contractsManaged money's net long grew by 5,820 contracts this week and 38,015 over four weeks.
Gold
Net long 131,334 contractsManaged money's net long shrank by 5,726 contracts this week and 19,981 over four weeks. It sits at the 42nd percentile of its three-year range.
Elsewhere
Four other positions worth a look.
Natural gas shorts were cut
Managed money held 32,376 fewer short contracts, narrowing its net short by 34,392 to 65,632. The balance is still net short.
Cocoa reached the short end of its range
Managed money's net short grew by 6,977 to 19,422, the 4th percentile of its three-year range.
The peso and corn stay long, and unusually so
Leveraged funds' peso net long fell by 10,820 to 79,188, and managed money's corn net long fell by 12,405 to 414,437. Both remain at the long end of their three-year ranges, now the 98th percentile.
Lean hogs stay at the short end
Managed money is net short 35,548, at the 1st percentile of its three-year range, and has been at the short end for 17 consecutive reports.
One week later
Copper's rebuild, and the yen's fading long.
- Last week: copper's long shrank. Managed money cut its copper net long by 16,476 contracts to 65,541. The question was whether that retreat would continue.
- This week: it rebuilt, to a three-year high. The net long grew by 17,108 to 82,649, the 100th percentile of its three-year range. Managed money added 12,644 long contracts and cut 4,464 shorts.
- The yen's new long mostly faded. After turning net long at 23,170 last week, leveraged funds' yen position shrank by 15,747 to 7,423, about 2.0% of open interest. Open interest also fell 30.2%.
- Next report: More copper longs would extend the rebuild. For the yen, a return below zero would undo last week's crossing entirely.
Positioning reference
Where positioning sits in its 3-year range.
| Market | Net position | 3-year percentile | At this end |
|---|---|---|---|
| Copper | Net long 82,649 (25.7% of open interest) | 100th | New this week |
| Gasoline (RBOB) | Net long 96,163 (26.5% of open interest) | 99th | 6 reports |
| Soybeans | Net long 265,041 (18.5% of open interest) | 99th | 5 reports |
| Lean Hogs | Net short 35,548 (8.5% of open interest) | 1st | 17 reports |
| Sugar No. 11 | Net long 224,006 (16.1% of open interest) | 98th | 6 reports |
| Mexican Peso | Net long 79,188 (29.8% of open interest) | 98th | 9 reports |
| Corn | Net long 414,437 (15.5% of open interest) | 98th | 6 reports |
| Cocoa | Net short 19,422 (8.3% of open interest) | 4th | New this week |
How to read the table
Side and unusualness are different questions.
The percentile places each net position among its last 156 weekly readings. It says how unusual a position is, not which side it is on: a net long can sit at the short end of its range.