
The read
The broad index short eased, but the Nasdaq short did not. Leveraged funds covered 41,275 S&P 500 contracts and 14,644 Russell 2000 contracts while adding 10,264 Nasdaq-100 shorts. Away from equities, fresh length appeared in copper and grains while several currency shorts stayed close to the edge of their recent ranges.
The anchors
ES · CL · GC
ES
Net short 329,314 · 16.8% of open interest · z +1.37 · COT Index 57.4The headline short remains large, but the weekly change was 41,275 contracts of short covering. Index futures positioning carries substantial hedging flow, so the movement in the position is more informative here than the absolute number.
CL
Net long 86,905 · 3.4% of open interest · z +0.37 · COT Index 33.9WTI was quiet in the latest report. The one-week change was small, while the four-week record still shows length being removed.
GC
Net long 123,586 · 23.6% of open interest · z +0.25 · COT Index 51.3Gold accumulated for a second week, but its position remains near the middle of its recent history. Nothing is stretched here.
The move this week
The equity adjustment split in two.
S&P 500 and Russell 2000 shorts eased, while the Nasdaq-100 short moved deeper into its extreme range. Grain positioning also firmed together, with one-week flows of +52,212 in soybeans, +49,518 in corn and +17,449 in wheat. The VIX long extreme eased by 7,091 contracts, although its four-week flow remains positive by 21,961.
Four things that moved
The changes behind the headline.
S&P 500
Leveraged funds covered 41,275 contracts in one week, lifting the position to z +1.37 and moving the regime from Neutral to Building Long. The position remains net short, but the direction of travel changed.
Nasdaq-100
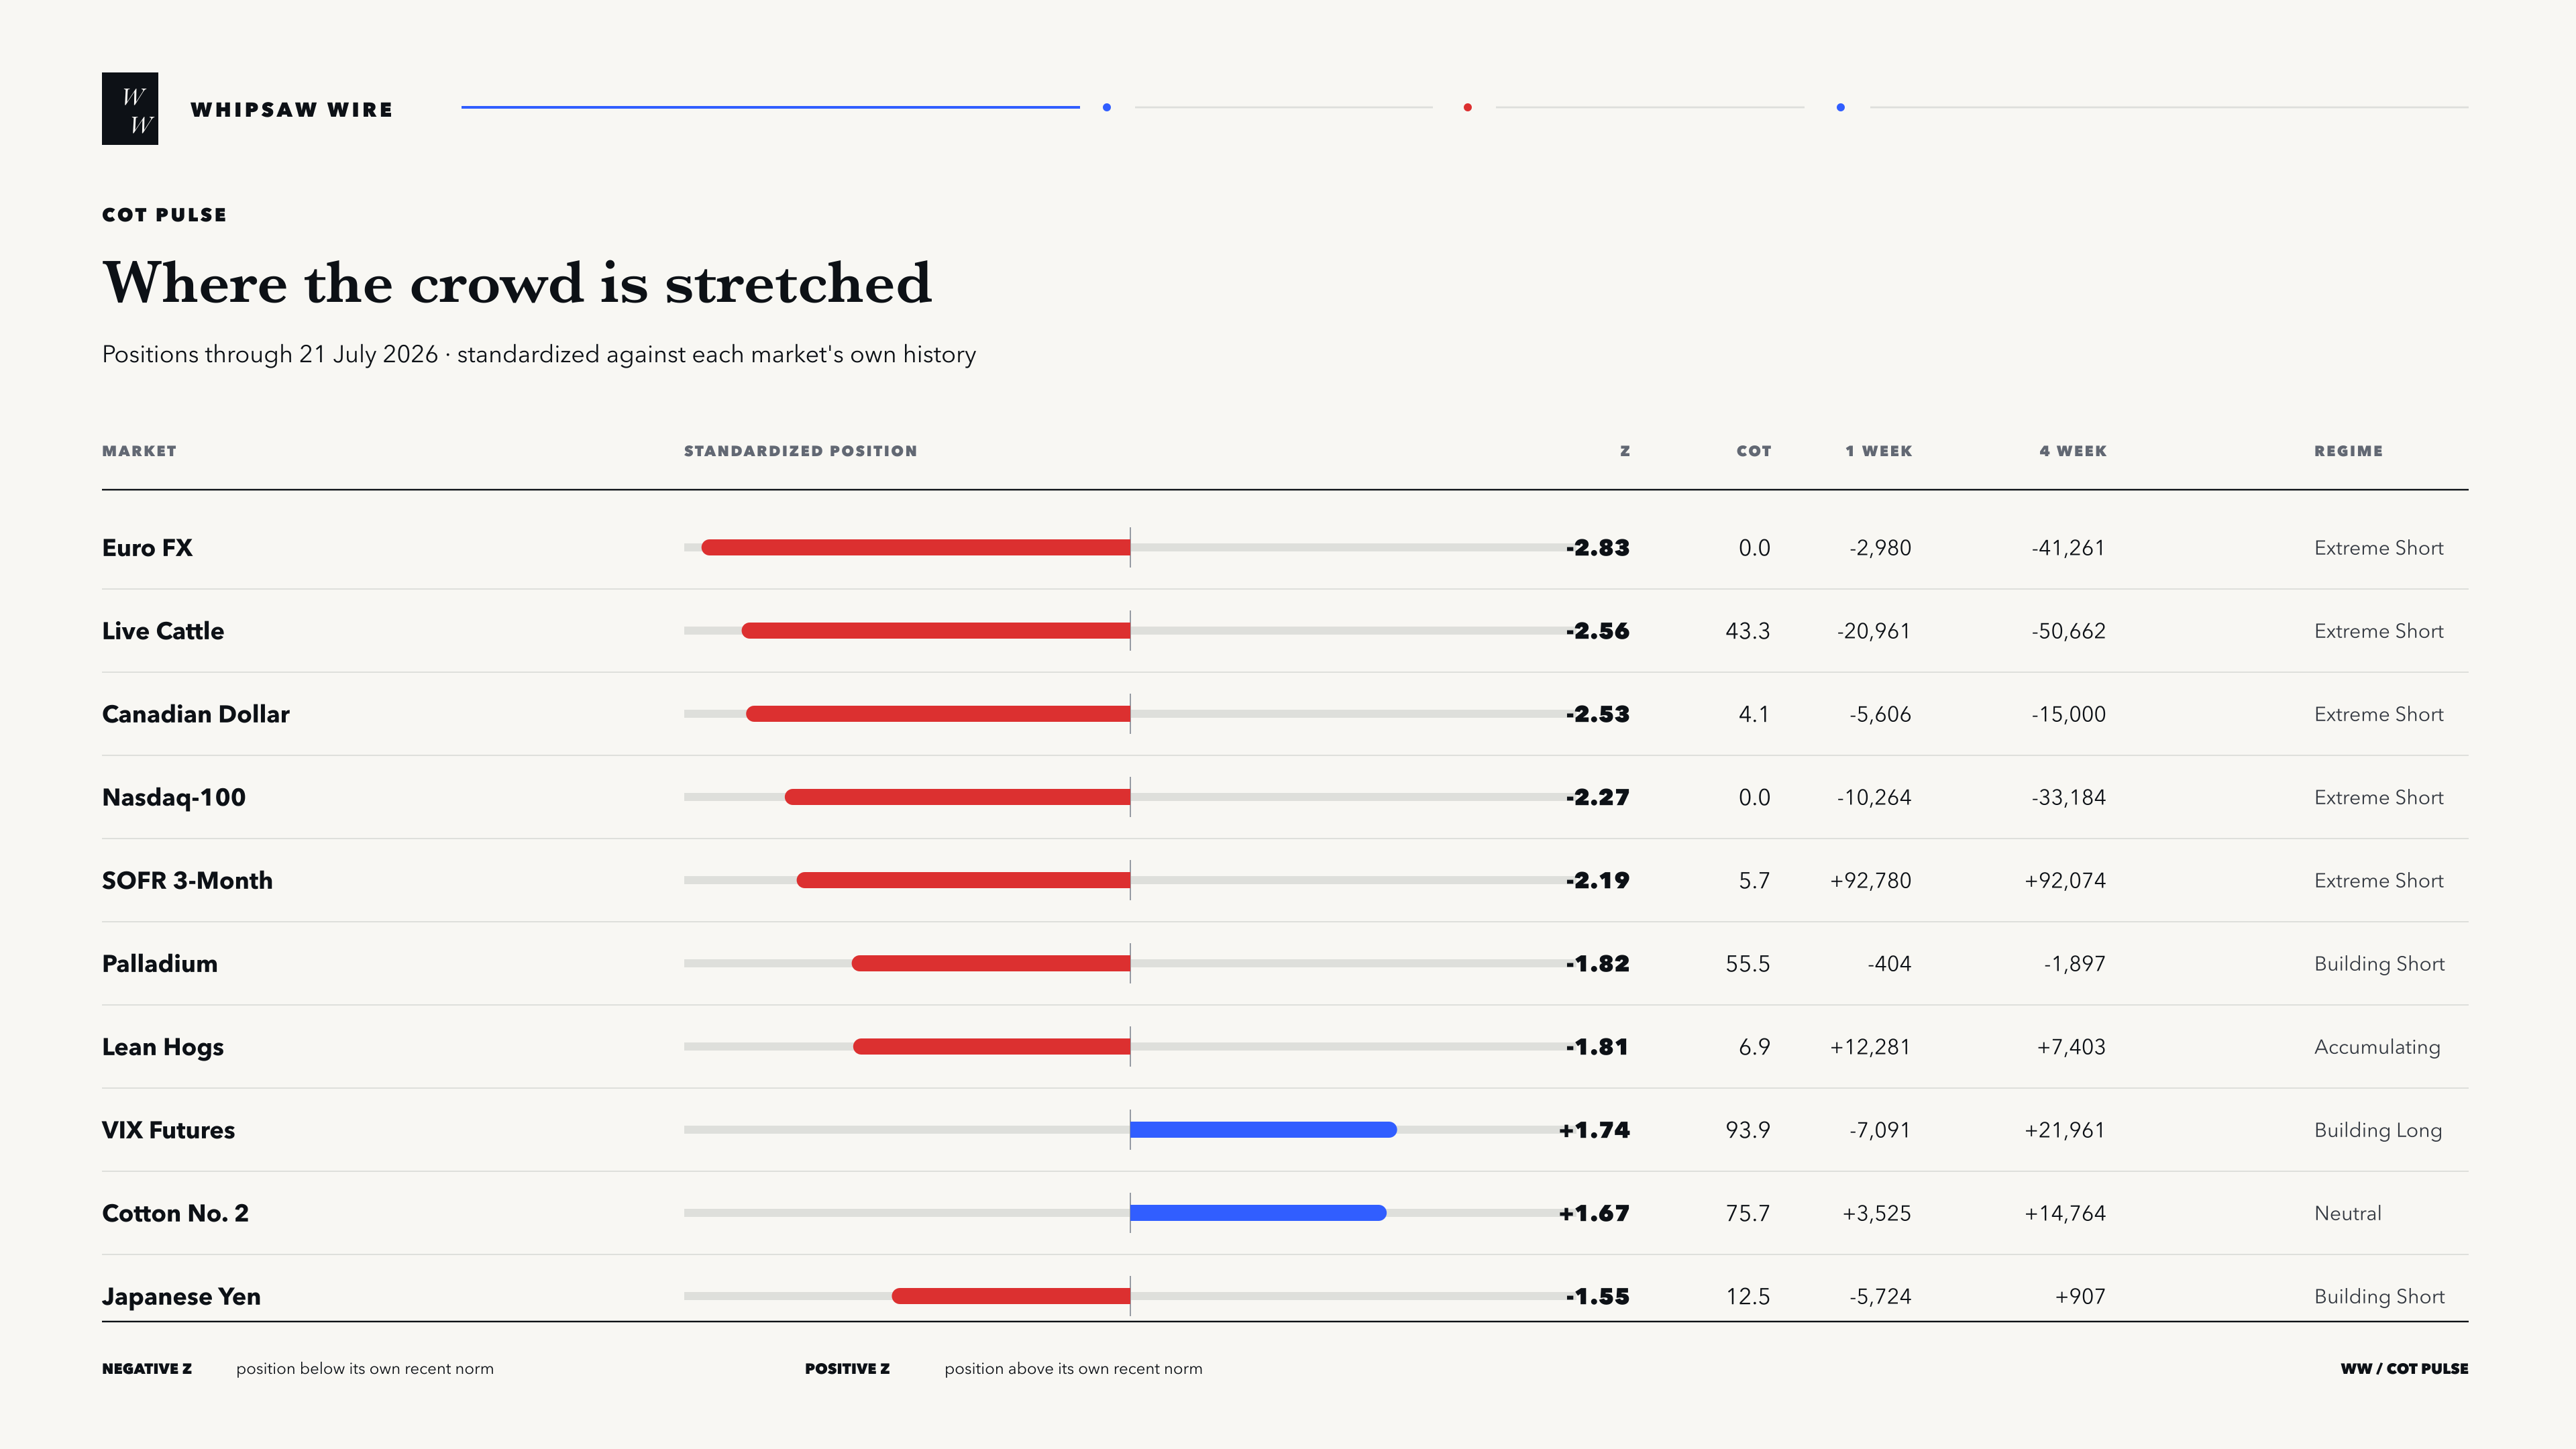
Leveraged funds added 10,264 shorts, taking the net position to -90,587 contracts, or 29.1% of open interest. The z-score moved from -2.03 to -2.27, and the COT Index stayed at 0.
Live Cattle
Managed money removed 20,961 longs in one week and 50,662 over four weeks. The position is still net long 75,363 contracts, but the standardized reading fell to z -2.56.
Copper
Managed money added 11,753 contracts, bringing the net long to 73,685 and the COT Index to 97.1. Open interest expanded as the position moved into Building Long.
Positioning extremes
Where the crowd is stretched.
Comparable histories
One word, two different paths.
The short that historically persisted: Natural Gas
Managed money is net short 102,694 Henry Hub contracts, with positioning at z -1.11. Across 90 prior weeks in the same positioning bucket, the contrarian long was positive 43.3% / 34.4% / 31.5% of the time after 4 / 8 / 12 weeks. The average twelve-week price move was -4.47%.
In this market, a stretched short has more often persisted than reversed over the following twelve weeks.
The high reading that historically reversed: Wheat
Wheat positioning rose for a fourth week, including a 51,857-contract four-week change, and now sits at z +1.11 even though managed money remains net short in absolute terms. Across 77 prior weeks in the same positioning bucket, the contrarian move was positive 67.5% / 67.5% / 68.0% after 4 / 8 / 12 weeks. The average twelve-week price move was -3.01%.
The same standardized word, stretched, has carried a different historical path here. The market's own record matters more than the label.
Who is on the other side
Copper carries the cleanest participant split.
- Managed money+73,685
- Producers and merchants-90,647
- Swap dealers+7,700
- Other reportables+1,137
- Nonreportables+8,125
Managed money carries the visible long while producers and merchants hold the largest offsetting short. Open interest expanded during the latest addition.
The crowding tell
Yen shorts run across several participant groups.
Leveraged funds are net short 96,185 contracts, asset managers are net short 79,906, and nonreportables are net short 2,773. The z-score is -1.55 and the COT Index is 12.5.
That alignment marks crowding. It does not provide a clock.
One week later
How last week’s extremes are tracking.
- Euro FX held. Another 2,980 shorts were added. The reading eased slightly from z -3.02 to -2.83 but remained at a COT Index of 0.
- SOFR began to unwind. 92,780 contracts were covered, yet the position remains an Extreme Short at z -2.19.
- Canadian dollar deepened. Another 5,606 shorts were added, taking the z-score from -2.40 to -2.53.
- Lean hogs unwound. 12,281 contracts were added after fourteen weeks of selling, moving the regime from Extreme Short to Accumulating.
- VIX eased. 7,091 longs were removed, shifting the regime from Extreme Long to Building Long.
- Nasdaq-100 deepened. Another 10,264 shorts were added and the z-score moved from -2.03 to -2.27.